Introduction
Enapter EMS uses Enapter Blueprints to automatically generate telemetry visualization dashboards for analyzing data from your devices. These dashboards work well for most use cases, but if you need a more tailored solution, you can create custom dashboards.

Here are some features of custom dashboards:
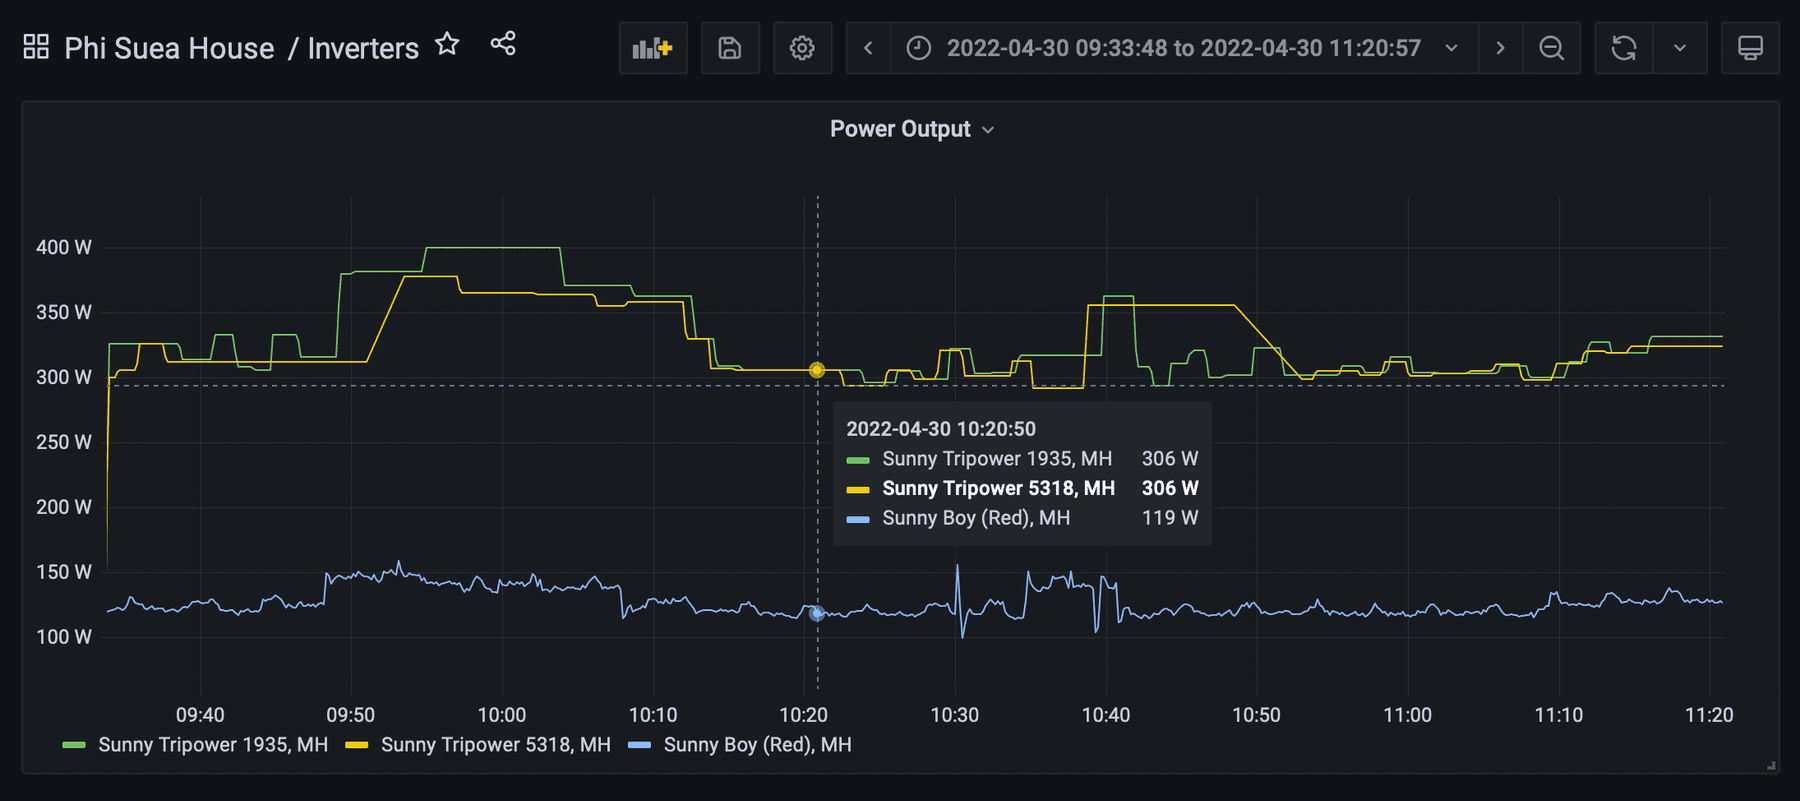
- Multiple device metrics on a single panel. Combine the telemetry of different devices (e.g., an Electrolyser and a Solar Inverter) and analyze their correlation.
- Device commands. Interact with your devices directly from the dashboard and see the changes in real time.
- Integration with Grafana. If you already use (or want to use) Grafana as your monitoring solution, install the Enapter API data source plugin to query device telemetry stored in Enapter EMS.
Setup
You can set up custom dashboards in three ways:
- Enapter Cloud Hosted
- Enapter Gateway Hosted
- Self Hosted
The easiest way to discover and use custom dashboards is with Enapter Cloud, which offers a hosted, durable, high-performance Grafana instance with Enapter plugins pre-installed.
To use the Enapter Cloud-hosted solution:
- Create an account in Enapter Cloud.
- Contact us at developers@enapter.com to gain access to the dashboards page.
In case you are running Enapter Gateway 3, you can enable Grafana to create custom dashboards that can be displayed on external screens, such as a TV or an operator PC.
- Connect over SSH to your gateway as the enapter user:
ssh enapter@enapter-gateway.local
- Edit the docker-compose.yaml file:
sudo nano /user/etc/docker-compose/docker-compose.yml
- Uncomment the lines so that the configuration looks like this:
services:
  grafana:
    user: root
    ports:
      - '0.0.0.0:3000:3000'
    env_file: /user/etc/enapter/enapter-token.env
    environment:
      - 'ENAPTER_API_URL=http://10.88.0.1/api'
    volumes:
      - /user/grafana-data:/var/lib/grafana
    image: enapter/grafana-plugins
- Save the changes and exit using the Ctrl+X shortcut.
- Restart
enapter-docker-composeservice:
sudo systemctl restart enapter-docker-compose
- Open a web browser and navigate to http://enapter-gateway.local:3000.
- Use the default login admin and password admin to sign in to Grafana.
If you prefer to run custom dashboards locally on your own hardware, you can download the Enapter Grafana Plugins and install them in your own Grafana instance.
To host custom dashboards on your hardware:
- Create an account in Enapter Cloud.
- Issue an Enapter API Token.
- Install and configure the Enapter Grafana plugins.