Query Language
To visualize data from Enapter EMS, you need to use a simple query language based on YAML.
Here's what a typical request looks like:
telemetry:
  - device: YOUR_DEVICE
    attribute: YOUR_TELEMETRY
Basics
Suppose we have a hydrogen sensor capable of measuring H2 concentration in a hydrogen tank. Let's see how we would query its readings.
Device
First, we need to know the device ID or slug of the sensor. You can find it on
the device page in the Enapter EMS web interface. A device ID is a UUID that
looks like this: acde070d-8c4c-4f0d-9d8a-162843c10333.
Telemetry
Next, we need to know the names of the sensor's metrics. Blueprint developers
describe device telemetry in manifest.yml, so let's take a look at the
telemetry section of the sensor's manifest:
# Sensors data and internal device state, operational data
telemetry:
  # Telemetry attribute reference name
  h2_concentration:
    # Attribute type, one of: float, integer, string
    type: float
    # Unit of measurement
    unit: "%LEL"
    display_name: H2 Concentration
The h2_concentration metric of type float is defined there.
Exactly what we need.
The fictional H2 sensor has only one metric, but other devices are likely to have many. You can request any metric as long as it is declared in the manifest and there is relevant data in Enapter EMS.
Result
Now we have all the components required to build the request:
telemetry:
  - device: acde070d-8c4c-4f0d-9d8a-162843c10333
    attribute: h2_concentration
This is enough for simple use cases, but if you want to explore additional features, keep reading.
Deeper Dive
The request we just built will automatically expand to something like this:
telemetry:
  - device: acde070d-8c4c-4f0d-9d8a-162843c10333
    attribute: h2_concentration
granularity: 1m
aggregation: auto
Let's make sense of this.
Granularity and Aggregation
Say we want to request one day of sensor readings. How much data will the response contain?
| Time | Value |
|---|---|
| 2022-07-10 09:00:00 | 0.00005 |
| 2022-07-10 09:00:01 | 0.00006 |
| 2022-07-10 09:00:02 | 0.00006 |
| ... | ... |
| 2022-07-11 09:00:00 | 0.00005 |
| 2022-07-11 09:00:01 | 0.00005 |
| 2022-07-11 09:00:02 | 0.00004 |
If the sensor sends one data point per second, there will be 24 * 60 * 60 = 86400 data points per day.
You probably don't need this many.
If each point on a graph is one pixel and you have a 4K display, your computer
can't draw a horizontal line longer than 4096 points. Dashboards often display
multiple graphs side by side, so panels are usually half as wide. This means
you could request about 86400 / (4096 / 2) ~= 42 times fewer data points and
still get a smooth graph - not even counting panel padding!
To load dashboards faster, we need to reduce the amount of data processed and transferred over the network.
This can be done by:
- Grouping data points by a time interval (e.g.,
1m); - Applying an aggregation function to each group (e.g.,
max); - Returning only the aggregated result.
| Time | Max Value (per 60s) |
|---|---|
| 2022-07-10 09:00:00 | 0.00006 |
| 2022-07-10 09:01:00 | 0.00005 |
| 2022-07-10 09:02:00 | 0.00006 |
Such group of data points is called a time bucket.
granularity defines the time interval that determines the size of a time
bucket. By default, Enapter EMS automatically selects a granularity that
makes the graph look good while keeping the query lightweight.
aggregation specifies the function applied to all data points whose
timestamps fall within the same time bucket.
Currently supported aggregation functions
avg- calculate the arithmetic mean;last- use the last known value;auto- automatically selectavgorlastdepending on the data type;min- find the minimum value;max- find the maximum value.
Gap Filling
Sometimes data sorted into time buckets can have gaps. This can happen if you have irregular sampling intervals, or you have experienced an outage of some sort. Gaps might make data analysis difficult, e.g. you cannot sum two timeseries if one of them contains a time bucket that has no data at all.
Sometimes data grouped into time buckets has gaps - for example, due to irregular sampling intervals or outages. Gaps can make analysis difficult: you can't sum two time series if one contains a bucket with no data.
You can use gap filling to create additional rows in those gaps, ensuring that the results are contiguous and in chronological order.
Currently, the only supported gap-filling method is last observation carried
forward (locf).
LOCF
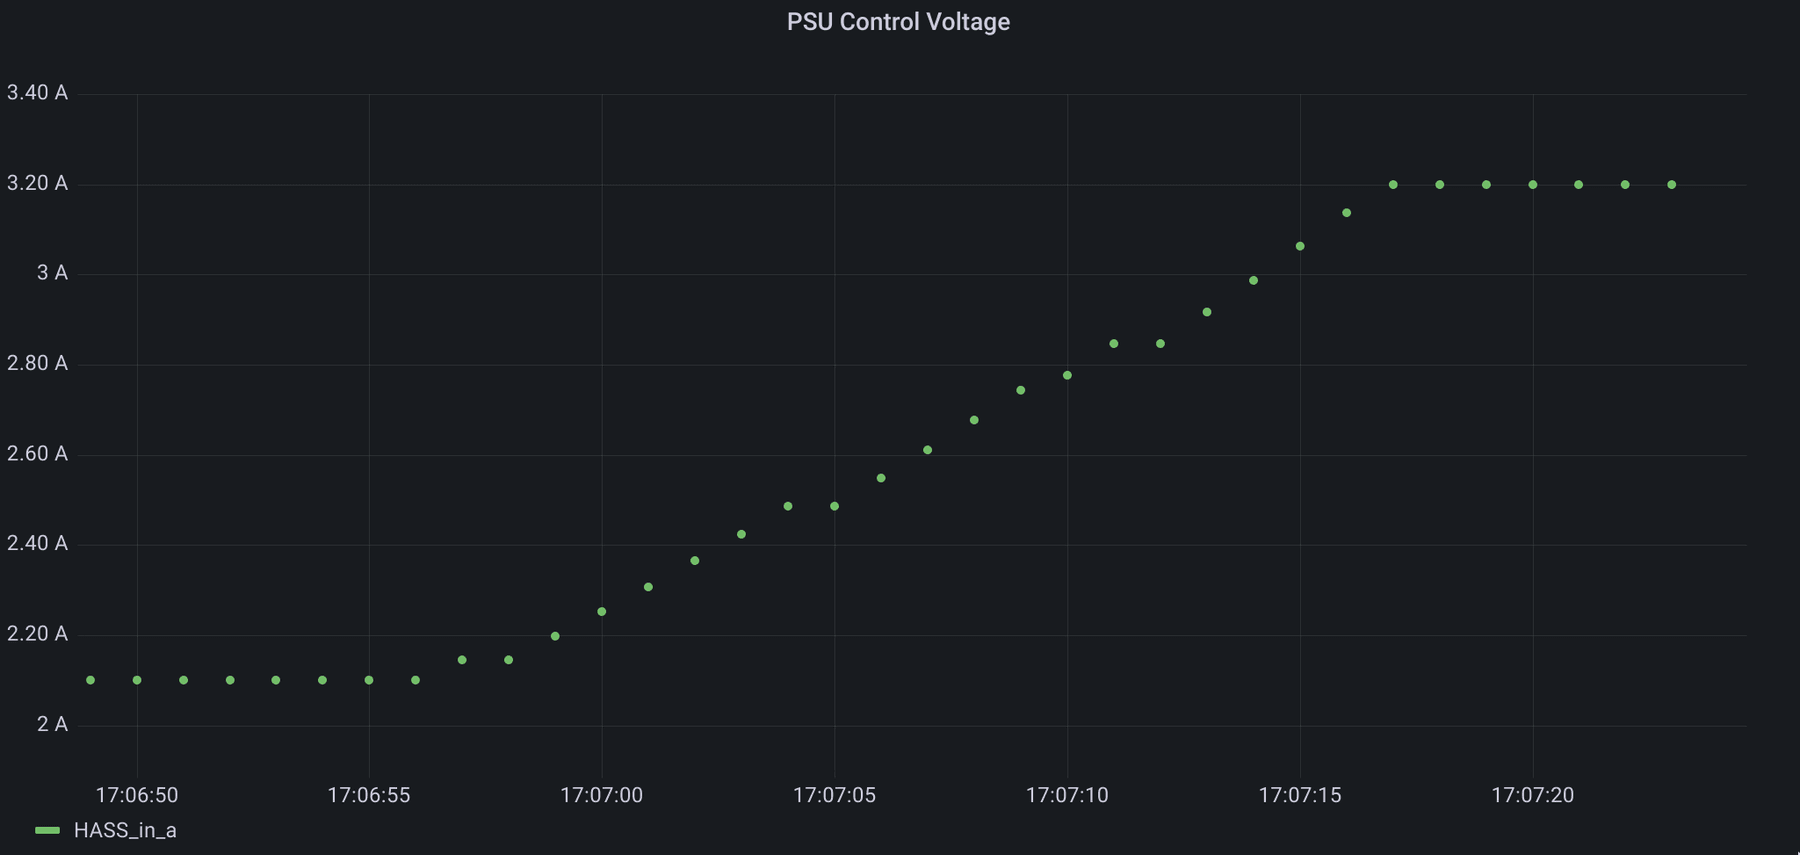
locf fills the gaps using the most recent observed value:

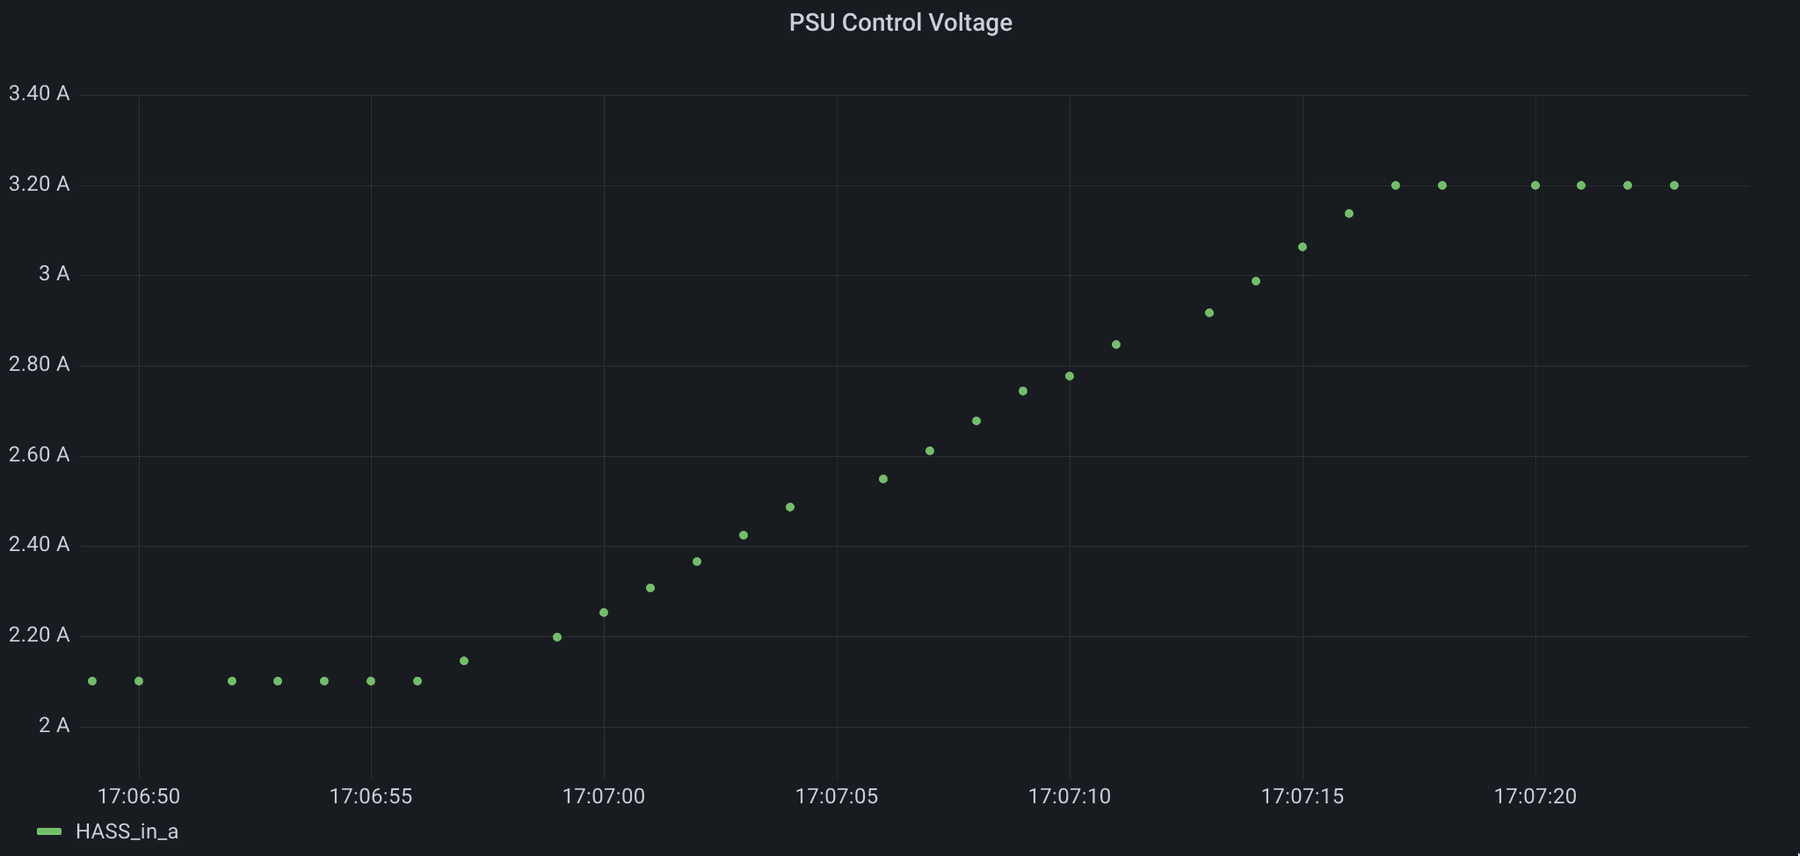
No LOCF

LOCF
Specify gap_filling.method in your query to enable locf:
telemetry:
  - device: acde070d-8c4c-4f0d-9d8a-162843c10333
    attribute: h2_concentration
granularity: 1m
aggregation: auto
gap_filling:
  method: locf
Because locf relies on having previous values to carry forward, it may not
fill the first time bucket if there's no earlier data. This can happen, for
example, when the query's time range starts in the middle of a gap.
To mitigate this, use the optional look_around parameter to specify how far
back to look for values outside the defined time range.
telemetry:
  - device: acde070d-8c4c-4f0d-9d8a-162843c10333
    attribute: h2_concentration
granularity: 1m
aggregation: auto
gap_filling:
  method: locf
  look_around: 10m
Telemetry Selectors
A common data analysis task is to compare the values of several metrics.
You might have noticed that the top-level telemetry YAML key corresponds to a
list of items:
telemetry:
  - device: acde070d-8c4c-4f0d-9d8a-162843c10333
    attribute: h2_concentration
Each item in this list is called a telemetry selector. A telemetry selector
describes which metrics from which devices should be queried. For example,
here's how to request h2_concentration from three devices:
telemetry:
  - device: acde070d-8c4c-4f0d-9d8a-162843c10333
    attribute: h2_concentration
  - device: 8bbd4d55-d6c4-4cc3-b1bb-e5a052df561b
    attribute: h2_concentration
  - device: 495006fb-06ac-4144-844a-1291baf61e1d
    attribute: h2_concentration
Device Selectors
Repeating the same metric name for multiple devices can be tedious, so a device selector helps simplify your queries.
The device key in a telemetry selector acts as a device selector - it defines
which devices to include in the query. You've already used the simplest form by
specifying a single device ID, but you can also select multiple devices at
once:
telemetry:
  - device:
      - acde070d-8c4c-4f0d-9d8a-162843c10333
      - 8bbd4d55-d6c4-4cc3-b1bb-e5a052df561b
      - 495006fb-06ac-4144-844a-1291baf61e1d
    attribute: h2_concentration
Attribute Selectors
The same logic applies when requesting multiple metrics from the same device.
The attribute key in a telemetry selector acts as an attribute selector - it
defines which metrics to include. You've already seen how to select a single
attribute by name; here's how to query several at once:
telemetry:
  - device: acde070d-8c4c-4f0d-9d8a-162843c10333
    attribute:
      - h2_concentration
      - amperage
      - voltage
You can combine device and attribute selectors!
This query will request a total of nine metrics:
telemetry:
  - device:
      - acde070d-8c4c-4f0d-9d8a-162843c10333
      - 8bbd4d55-d6c4-4cc3-b1bb-e5a052df561b
      - 495006fb-06ac-4144-844a-1291baf61e1d
    attribute:
      - h2_concentration
      - amperage
      - voltage
Label Matchers
Each device and each telemetry attribute have a set of labels associated with them. Device and attribute selectors can match these labels using predefined operators.
Take this example:
telemetry:
  - device: acde070d-8c4c-4f0d-9d8a-162843c10333
    attribute: h2_concentration
This device selector is equivalent to the following:
telemetry:
  - device:
      id:
        is_equal_to: acde070d-8c4c-4f0d-9d8a-162843c10333
    attribute: h2_concentration
This means: select all devices with an ID equal to
acde070d-8c4c-4f0d-9d8a-162843c10333.
It may seem redundant now, but the longer form becomes useful when more device labels are available.
The same logic applies to the attribute selector:
telemetry:
  - device:
      id:
        is_equal_to: acde070d-8c4c-4f0d-9d8a-162843c10333
    attribute:
      name:
        is_equal_to: h2_concentration
This query selects all telemetry attributes whose name equals
h2_concentration.
Currently supported device labels are:
id- internal device identifier;slug- user-friendly alias;
Currently supported attribute labels are:
name- name of the attribute as in Blueprint.
Currently supported match operators are:
is_equal_to— match if the label value is exactly equal;matches_regexp— match if the label value matches the specified POSIX regular expression.
You may find the matches_regexp match operator useful to query a
bunch of similarly named entities.
matches_regexp match operator useful to query a
bunch of similarly named entities.E.g., if you have a device with attributes power_1, power_2 and power_3,
all of these attributes can be conveniently queried like this:
telemetry:
  - device: b078c90e-2da6-4886-8250-a9c2cb07de16
    attribute:
      name:
        matches_regexp: power_\d